What a CI job does on the network and when is a goldmine. Builds spend a shocking fraction of their wall clock waiting on the network: pulling images, resolving and downloading dependencies, hitting caches, cloning repos. When a customer asks "why is this build slow?", the answer is very often hiding in a flow nobody knew existed: the registry that isn't cached, the dependency fetched from the other side of the world, the test suite quietly downloading a browser binary on every run. Beyond performance, knowing exactly what every job talks to is the basis for something bigger: an egress policy system that can actually protect builds when a dependency turns malicious. That's Part 2.
We set out to capture a complete and queryable record of all outbound network traffic, attributed to the domain name per job and even per step. Blacksmith's whole pitch is the fastest, most broadly compatible runners around so many were off the table from day one: no man-in-the-middle proxy with an injected certificate authority (breaks certificate pinning, breaks tools that ship their own trust stores, breaks the "drop-in" promise); nothing that adds measurable latency or per-byte cost to the data path; and nothing inside the guest at all, both because the workload is untrusted and because we refuse to change what a customer's build sees.
What made this tractable is where we get to stand. Every Blacksmith CI job runs in its own ephemeral VM, and all of that VM's traffic crosses a single veth pair on the host. The guest can't see it, can't reconfigure it, and can't route around it whatever we build there is invisible to the workload and immune to it. Three problems make what we built there more interesting than "run tcpdump on the veth":
Everything meaningful is a name, but the kernel deals in IPs. Knowing a job sent 4 MB to 140.82.113.4 is close to useless; knowing it went to github.com:443 is the whole point. We solve attribution by owning DNS with a host-side proxy.
The data path must cost approximately nothing. We observe at line rate with eBPF programs attached via TCX. We'll get into why that beats both a userspace proxy and iptables counters.
The collection mechanism needs bounded, low overhead Per-destination counters of every VM, read out every second, without a per-packet event stream. The mechanism, BPF map iterator programs, is a lesser-known corner of eBPF worth highlighting.
One premise shapes every design decision that follows: the workload inside the VM is hostile. A CI job runs arbitrary code, and that code can become root inside the guest. Anything living in the guest is within the blast radius of the thing we're trying to observe, so nothing in the guest can be a source of truth.
Every mechanism in this system therefore lives outside the guest in the host kernel or in a host-side process. It's a clean boundary: the workload owns everything on its side of the virtual NIC, and we own everything on ours. Nothing the guest does can hide evade detection.
Here's the path a packet takes leaving a Blacksmith VM:
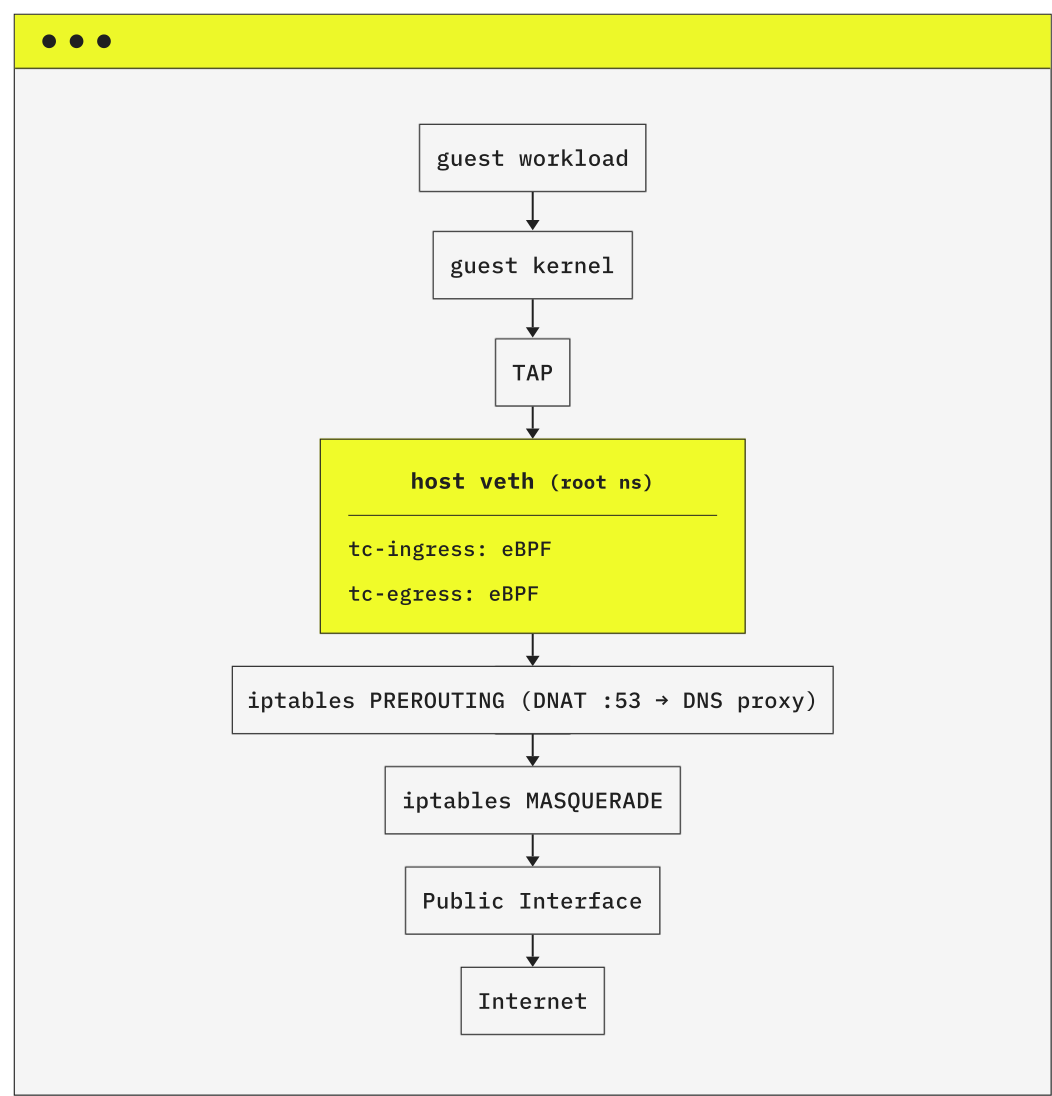
Every VM gets a veth pair straddling the guest's network namespace and the host root namespace, and all of the guest's traffic has to transit the host-side end of that pair to reach the internet. We attach two things there: an eBPF program at each direction of the veth (ingress and egress, so we can count bytes both ways), and an iptables rule that redirects the guest's DNS traffic to a proxy we control. Those two pieces, the eBPF observer and the DNS proxy, are the heart of the system. Let's take them in the order that makes the data meaningful: names first.
The kernel deals in IP addresses. Humans, and security policies, deal in names. If all we reported was "your job sent 4 MB to 140.82.113.4," you'd have to do the reverse lookup yourself and hope the answer was stable. Worse, that mapping is exactly the thing a hostile workload would love to muddy. So the first job is to reliably attribute every outbound flow back to the domain name the workload actually resolved.
We do that by owning DNS. A per-veth iptables DNAT rule rewrites the guest's port-53 traffic to a DNS proxy running in the vm-agent on the host bridge IP:
DNAT udp/tcp dport 53 -i <vm-veth> → 192.168.127.1:<proxy-port>The guest is none the wiser. Its /etc/resolv.conf still points at the conventional 192.168.127.1:53; the rewrite happens in the host kernel, below anything the guest can observe or reconfigure. Even if the workload rewrites resolv.conf to point at 8.8.8.8, the DNAT rule only rewrites port 53, and a workload that tries to talk to a resolver on some other port is a signal in itself.
On every query, the proxy transparently forwards the request to configured upstreams, and prior to returning the response, the proxy notes the name and the destinations to which it resolved. That record is what lets the eBPF layer downstream label a raw destination IP with the domain that produced it. That record is what lets the eBPF layer downstream label a raw destination IP with the domain that produced it.
With names handled, the eBPF programs on the veth do the actual accounting..For each packet, the program looks up the VM by its interface index, finds that VM's per-VM stats map, and updates a cumulative counter keyed by destination:
struct dst_key {
    __be32 ip;
    __be16 port;
    __u8   protocol;
    __u8   __pad;
};

struct dst_stats {
    __u64 bytes_sent;
    __u64 bytes_received;
    __u64 packets_sent;
    __u64 packets_received;
    __u64 first_seen_ns;
    __u64 last_seen_ns;
    // ...
};
The first packet to a new (ip, port, protocol) lazily creates the entry; subsequent packets just add to it. In pure observability mode the program never drops anything; it counts, stamps first_seen/last_seen, and gets out of the way. The maps are organized as a hash-of-maps keyed by interface index, so each VM has its own isolated inner map and no VM can consume another's accounting capacity. Everything is pinned in the BPF filesystem under a per-agent-PID directory, which is what makes crash recovery and concurrent-agent upgrades clean.
The way those programs get onto the veth matters as much as what they do. We attach them with tcx, the traffic-control hook that landed in Linux 6.6, rather than the classic tc/netlink path or an iptables-based approach. One attach per direction, the netpolicy_from_vm program at TCX ingress and netpolicy_to_vm at TCX egress and the data plane is live on that VM's interface. Three properties of TCX are why we chose it, and each one replaces a piece of bookkeeping we'd otherwise have to get right by hand.
It's a link, not a global filter. The classic approach means creating a clsact qdisc on the interface and hanging a tc filter off it. That’s problematic because it’s a shared, process-external state that outlives whoever installed it and that you have to reason about clobbering when something else touches the same interface. A TCX attachment is a link object whose lifetime is a file descriptor owned by our agent process. When the interface goes away the kernel drops the fd and auto-detaches the program. There are no orphaned tc filters to sweep up on the next boot, and no qdisc to create, share, or accidentally tear down. TCX has a well-defined multi-program ordering, so we can coexist with anything else on the interface instead of fighting over a single filter slot.
It sits in the right place for near-zero overhead. The programs run at the tc layer on the veth, in kernel context, on the packets that are already passing through. There's no extra copy and no context switch: a packet that's allowed is touched only long enough to bump a counter and is then on its way.
Contrast that with the most obvious alternative: a userspace network proxy. To observe (let alone filter) traffic through a proxy, you have to terminate the connection: accept the guest's socket, open your own upstream socket, and shuttle every byte through userspace, often terminating TLS to see anything useful. That's a copy in each direction, a scheduler round-trip per batch of packets, and a per-connection memory and CPU cost that scales with throughput. Our design keeps userspace on the control path (DNS, which is low-volume and where the interesting attribution happens) and leaves the data path, the bulk bytes of a docker pull or a dependency download, entirely in the kernel.
Its accounting is per-destination, not per-rule. You could approximate egress visibility with iptables: a chain of rules, each with a packet/byte counter. But iptables counters are per rule, not per destination. Getting per-VM isolation would mean minting a separate chain per VM and tearing it down on teardown, and the match cost is a linear walk of the chain. Our eBPF maps are keyed by (ip, port, protocol) with O(1) hash lookups (and an LPM trie for CIDR matching in the enforcement tier), one isolated map per VM, and the counters are attached to the destination itself. This is the granularity needed to later say "this job sent 4 MB to registry.npmjs.org:443." iptables is still the right tool for the one coarse thing we do use it for, a per-veth DNAT redirect of port 53, but it's the wrong tool for measurement.
TCX gives us kernel-speed, per-flow, per-VM visibility with process-scoped lifetimes and no global state to reconcile. A proxy would put every byte through userspace; iptables would give us coarse, per-rule numbers and a chain-management problem. Neither buys what a handful of eBPF maps behind a TCX link does.
We now have, for every VM, a kernel map full of per-destination counters. How do you get that out to userspace efficiently, once a second, across a host running many VMs?
The naive way to pull is to walk each map key-by-key from userspace, issuing a syscall per entry. Given syscalls take microseconds, we don’t know which entries have been recently updated, and there are thousands of entries, this can easily take 10s of milliseconds per job or single digit percent of CPU time for each job if we want data once a second. High resolution data is nice to have.
A common approach in eBPF is to use a ringbuffer. The most simplistic thing would be to write an entry for every packet, but that would be far too high overhead both in coordinating on the ringbuffer and userspace processing of records. A better ringbuffer approach might be a periodic program that runs and scans the map such as a perf event timer program. This would work, but we’d need to always have that ring buffer sized correctly and could risk losing some data.
Instead, we chose to use a BPF iterator program. This is a small iter/bpf_map_elem program that the kernel invokes once per map element; it serializes each entry into a fixed-layout record and writes it into a seq_file that userspace reads as a single streaming buffer:
SEC("iter/bpf_map_elem")
int dump_dst_stats(struct bpf_iter__bpf_map_elem *ctx)
{
    struct dst_key   *key = ctx->key;
    struct dst_stats *val = ctx->value;
    struct flowstats_record_header hdr = {};

    if (key == NULL || val == NULL)
        return 0;

    hdr.key           = *key;
    hdr.bytes_sent    = val->bytes_sent;
    hdr.bytes_received= val->bytes_received;
    // ... copy the rest of the counters ...
    hdr.record_len    = sizeof(hdr);
    hdr.version       = FLOWSTATS_RECORD_VERSION;

    bpf_seq_write(seq, &hdr, sizeof(hdr));
    return 0;
}
In the agent, we attach one iterator link per inner map, and each collection tick opens the iterator and decodes the resulting byte stream into records. One read, one pass, one compact binary buffer instead of N syscalls for N destinations.
A collector loop in the agent ticks every second, runs the iterator over each VM's stats map (and a parallel denial map, more on that in Part 2), and emits rows. Two small refinements make this cheap and correct at fleet scale:
max(...) over a window.last_seen advanced since the previous tick. A flow that goes idle stops producing rows instead of re-emitting the same numbers every second.The rows flow into ClickHouse tables with each row in the egress table identifies destination data: host, VM, job, destination IP/port/protocol, and the qname the DNS proxy attributed to it, along with the cumulative byte and packet counters in both directions and the flow's first_seen/last_seen timestamps.
Those two timestamps let us align a flow against job step boundaries, and because they ride alongside cumulative counters, they make the data robust to sampling loss. If a few one-second snapshots go missing, the latest surviving row still tells you the total bytes transferred and the interval they span. You lose some intra-flow resolution, never the totals. Another benefit of these cumulative rows is that if, for whatever reason, we need to backpressure how much data we’re sending to clickhouse, we don’t lose information about the throughput, we just lose resolution. By giving every row has a precise first_seen and the cadence is one second, we can slice a job's egress into whatever time windows we like after the fact. So long as traffic only happens in an individual GitHub Actions step we can easily correlate it to that step. The data plane on the host has no idea which Actions step is running at any moment (the runner owns that state, and step boundaries aren't known to the host in advance).
Every map and buffer is bounded so one noisy job cannot consume unbounded host resources. When a limit is hit, we emit overflow counters or sentinel rows so incomplete data is visible rather than silently dropped.
Domain attribution is admittedly best-effort. We observe destination IPs and separately record the DNS answers seen for each VM. That does not prove which name caused a connection. Multiple domains can share an IP, applications can use cached or hard-coded addresses, and encrypted DNS such as DoH can hide lookups from the proxy. In those cases we may report a raw IP or an ambiguous set of candidate names rather than a single domain.
The system is currently IPv4-only. Our VMs do not have IPv6 connectivity, and the observer and DNS attribution path only handle IPv4 addresses and A records. That is not a bypass in the environment we run today, but full IPv6 support would require changes across networking, packet parsing, attribution, storage, and enforcement.
That's the observability tier: default-on, pass-through, no drops, and a dataset broad enough to actually reason about what the fleet's jobs are doing on the network. What I like most about it is how little machinery it took: a DNS proxy, two eBPF programs, a handful of per-VM maps, and a collector loop. The same machinery has a second act. Part 2 turns the dial from watching to blocking: a default-deny egress allowlist written in terms of domains, enforced in the host kernel against a workload that's actively trying to get out. That's where the design decisions here: the approval-before-response ordering, the per-VM map isolation, and the visible-by-construction failure modes stop being nice properties and start being the security boundary.