On July 21, 2026, between approximately 10:20 AM and 3:55 PM ET, our control plane experienced significant service degradation. Customer jobs were not picked up by Blacksmith for several hours during this outage, completely blocking development workflows. Additionally, Actions cache operations, monitors, and sticky disk requests failed or timed out at elevated rates. As a result, job executions were noticeably slower across the board.
Control plane latencies recovered by 3:55 PM ET and the remaining job backlogs drained over the following hours, with service in most regions back to normal queueing latencies by approximately 5:25 PM ET (our eu-central region recovered at around 7:00 PM ET). Jobs that failed to dispatch during the incident were re-dispatched by 7:19 PM ET.
We apologize for the severe impact this had on our customers. Companies rely on Blacksmith to run their most critical workflows, and for most of a working day we did not deliver that. This post explains exactly what happened, why it took as long as it did to resolve, and what we are changing to prevent it from happening again.
Our control plane has a dependency on Redis in the hotpath that processes and queue customer jobs. The CPU load on that Redis instance had been ramping up over the past few weeks, but due to inadequate alerting we were not aware of the shrinking headroom. At around 10:20 AM ET, GitHub delivered an erroneous burst of out-of-order webhook events, mostly duplicate deliveries of webhooks we had already processed. That burst set off the following chain of events:
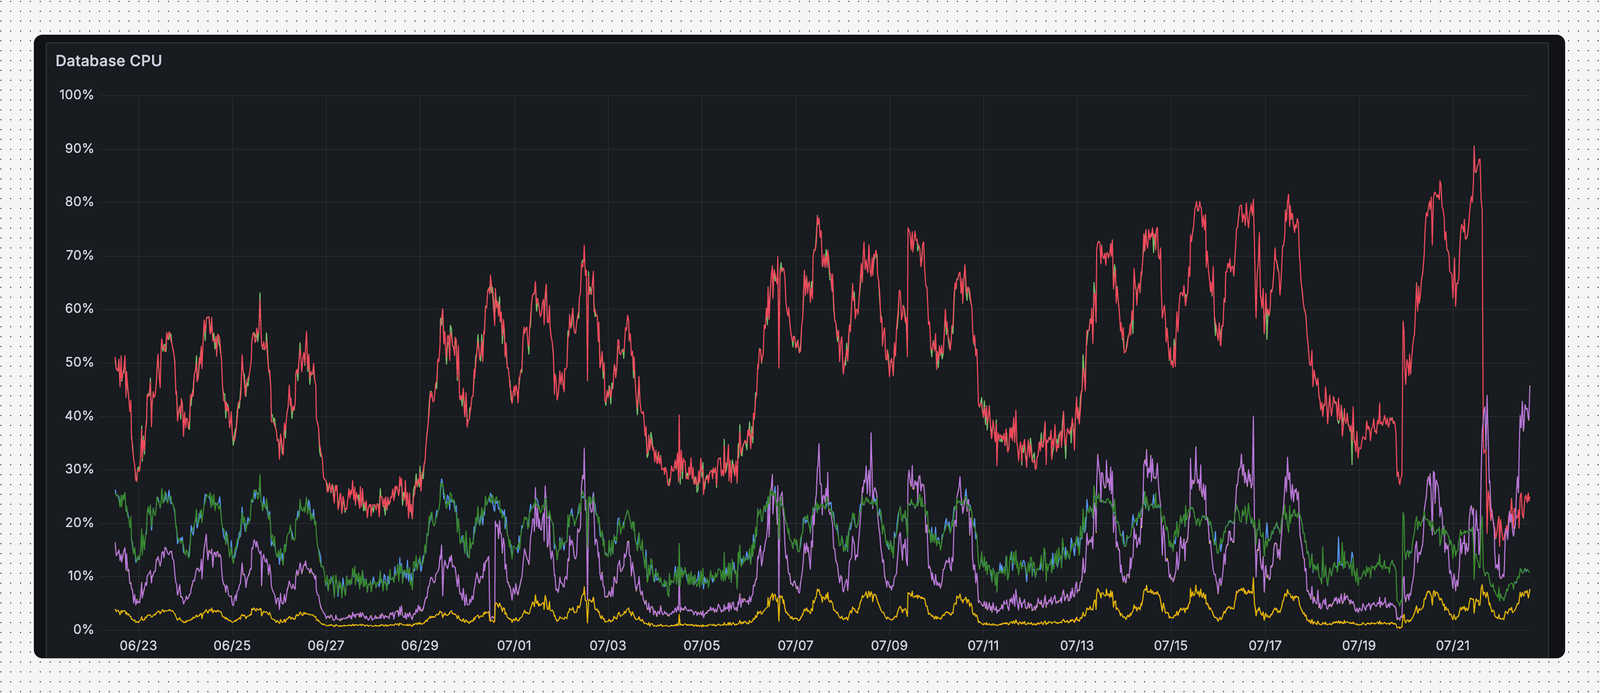
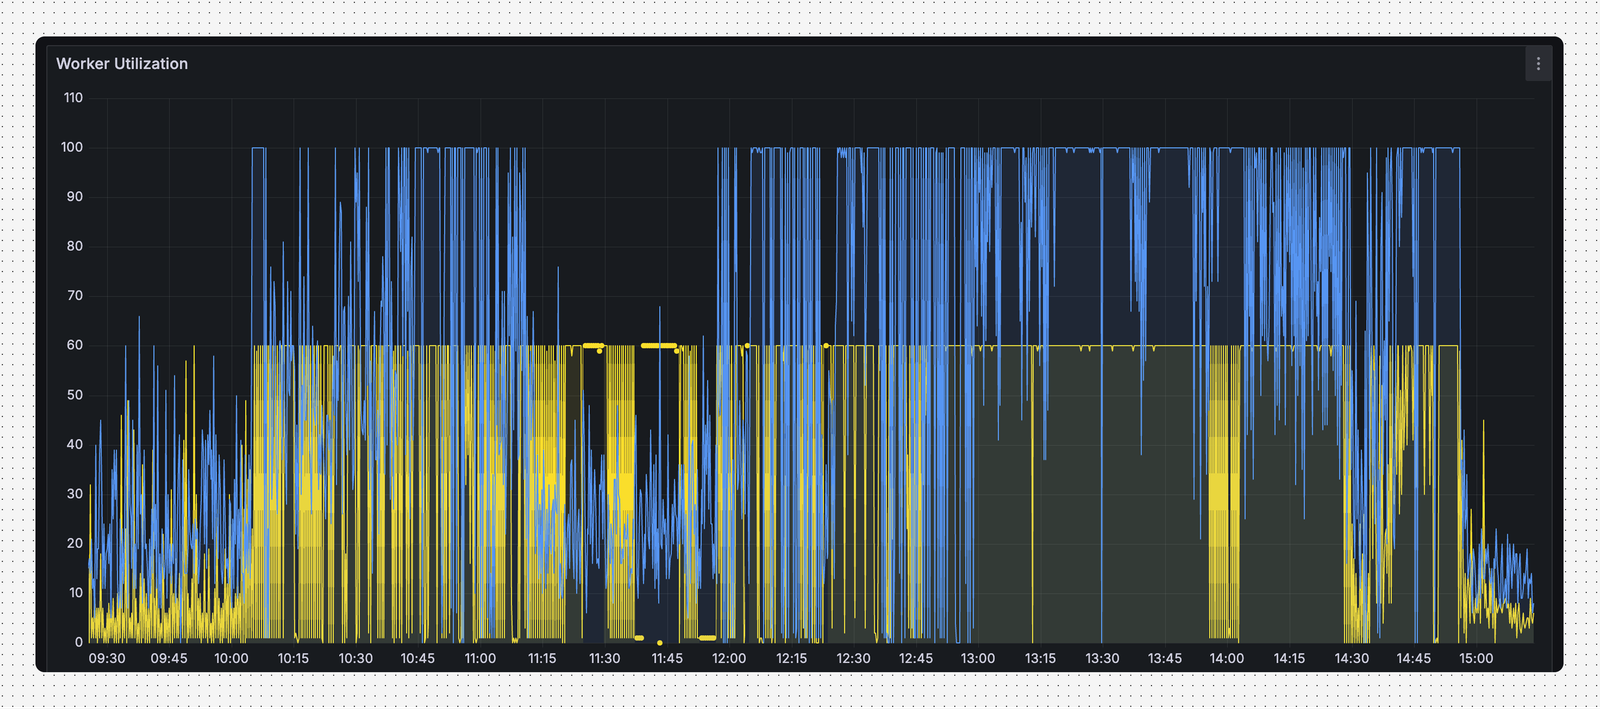
Two additional problems amplified the impact and extended the time to recovery.
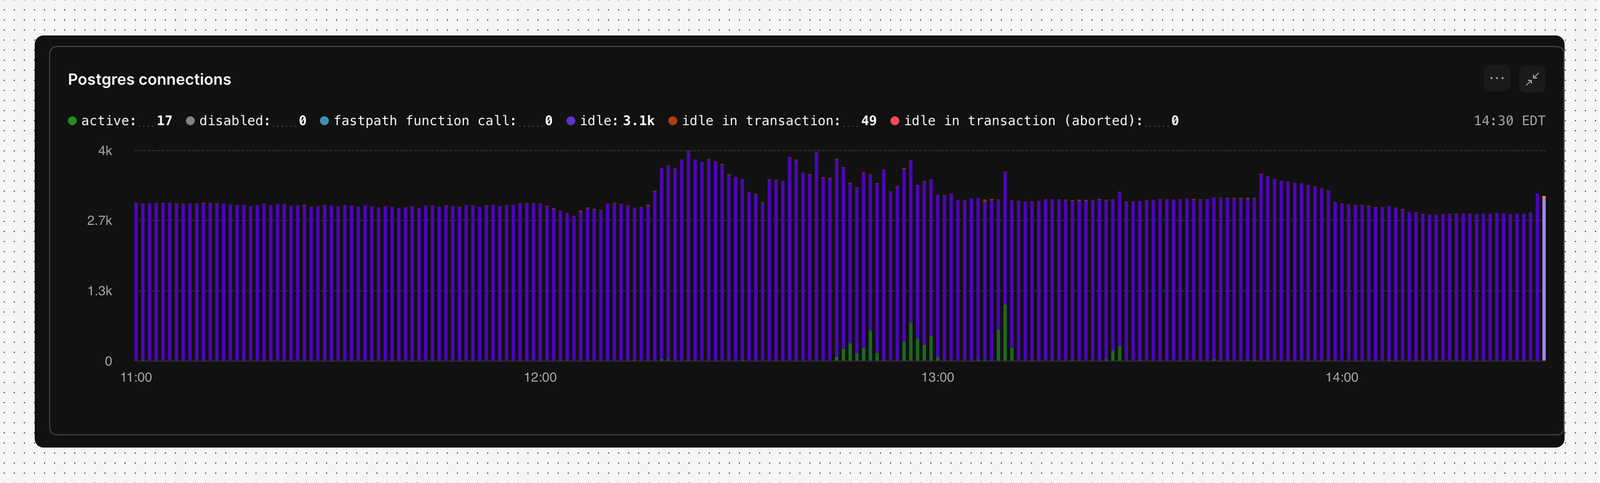
Our own scale-up overloaded the database connection pool. Early in the incident, we prematurely scaled up the HTTP worker pool to serve the growing request backlog. Every additional worker holds database connections, and the expanded fleet pushed us into our database's connection limit. Requests that were already slow waiting on Redis now also waited on database connections, and our own mitigation had added a second saturated system to diagnose. The database was now the loudest signal, and it pulled the investigation toward Postgres for several hours before Redis saturation was confirmed as the root cause. Once we understood the interaction, we scaled back down, which relieved the database but meant we could not add capacity to absorb the backlog.
Our health checks were served by the same saturated worker pool. Health check requests waited in line behind the backlog like every other request, and timed out. Our load balancer read those timeouts as instance failures and terminated instances that were actually healthy. For roughly two hours this recycled capacity as fast as we could add it, until we pointed the load balancer at a status endpoint unaffected by the backlog.
To address the immediate gaps, we are going to:
Looking ahead, Blacksmith's usage has grown substantially this year, and this incident is a reminder that capacity assumptions that held a few months ago no longer do. Since a set of capacity-related incidents in May, we have been re-architecting core subsystems across networking, storage, and job assignment to scale ahead of demand rather than react to it. This incident showed our control plane needs the same treatment. We are expediting that work and dedicating additional engineering to capacity headroom, monitoring, and alerting across every subsystem, so that erosion like the Redis CPU trend that set up this incident is caught and fixed before customers ever see it.
Beyond the technical failures, our communication during this incident was not acceptable. This was a multi-hour outage, and customers went long stretches without a status update. The updates we did post did not clearly state what was impacted, what we were doing, or when to expect the next update.
We are instituting a formal incident response plan to fix this: every incident gets a dedicated communications owner, status page updates at least every 30 minutes, and every update states the current customer impact and the time of our next update. These commitments hold whether or not we have new information to share.
We apologize for the disruption. If you experienced impact that was not covered above, please contact our support team. We're happy to go deeper on the details.